
This guide explains the meaning of each metric on Store Performance and how to use the data to improve store performance. Applicable to Join Fulfill sellers.
Access Store Performance #
The Store Performance option is located in the Performance group on the sidebar. Select the appropriate time frame before reading the data.
- From the sidebar, select Performance > Store Performance .
- Choose a time frame from the filter above: Today , Last 7 Days , Last 30 Days , or Custom .
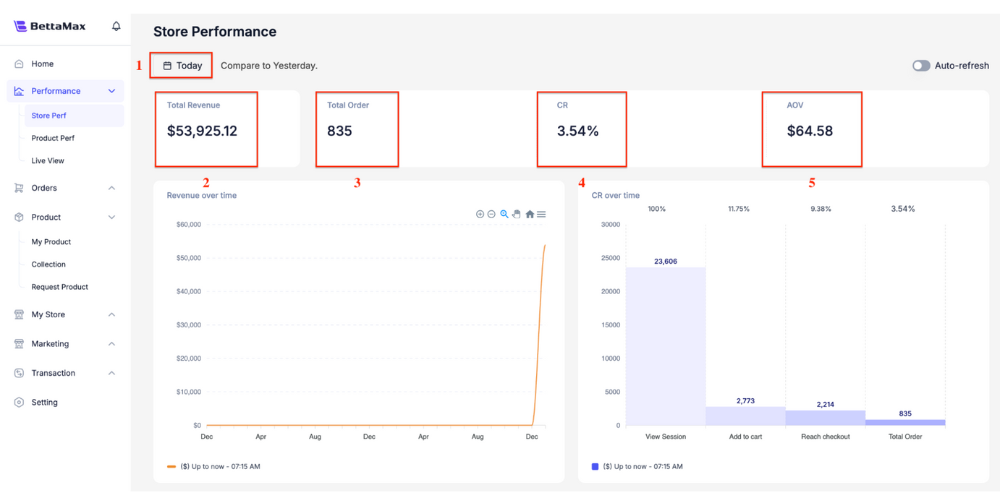
- The dashboard displays all indicators for the selected period.
Read and understand each indicator. #
Each metric on Store Performance answers a specific question about store effectiveness. Understanding their meaning correctly helps you identify areas for improvement.
Total Revenue #
- What is it? Total revenue = total product price + shipping fee collected from customers (before deducting expenses).
- Used for: Tracking the total amount of money the store generates and comparing growth over time.
- Note: High revenue does not necessarily mean high profit . Fulfillment costs should also be considered for an accurate assessment.
Profit #
- What is it? Net profit = Revenue – Fulfillment Cost – Payment gateway fee – Discount .
- Used to: Assess the true health of the store.
- Benchmark: A profit margin of 20-30% on revenue is a reasonable level for typical dropshipping.
Orders #
- What it is: The total number of orders created during the period.
- Used for: Monitoring volume, combined with AOV to understand revenue structure.
Conversion Rate #
- What it is: The percentage of store visitors who make a purchase.
- Benchmark: A conversion rate of 1-3% is considered average for dropshipping. A rate below 1% requires reviewing product pages, pricing, or traffic sources.
- Used to: Evaluate the effectiveness of product pages and the checkout process.
AOV (Average Order Value) #
- What is it: Average Order Value = Total Revenue / Orders .
- Used to: Evaluate the effectiveness of upsell/cross-sell. Low AOV can be increased through bundling, free shipping thresholds, or upsell offers.
Analyzing trends over time #
Comparing data across periods helps identify trends and assess the impact of changes you make. The most effective way to compare data is to use Custom to select the specific period you want to compare.
- Select Last 7 Days and record Revenue , Profit , and Conversion Rate .
- Switch to Custom , select the 7 days of the previous week (including the same day of the week).
- Compare each indicator to determine improvement or decline.
- Note the changes you made during the period (new ads, price changes, added products) to explain the fluctuations.
Signals to pay attention to #
Certain abnormal combinations of indicators often signal problems that require prompt action. The table below lists common scenarios and suggested actions.
| Signal | Common causes | Suggested actions |
|---|---|---|
| Revenue increases, Profit decreases. | Fulfillment costs increase or discounts are too high. | Double-check the selling price and discount policy. |
| Orders increase, Conversion Rate decreases | Traffic increased but the quality was poor. | Review your advertising targeting. |
| Conversion rate is below 0.5% | Weak product pages or uncompetitive pricing. | A/B test the product page, review the price. |
| AOV is continuously decreasing. | The best-selling product is the low-priced product. | Add upsell or bundle offers |