
This guide will help you read and use Live View to monitor your store’s activity in real time on BettaMax. Live View displays visits, orders, and customer behavior over the past 30 minutes on a 3D world map. This feature is especially useful when running advertising campaigns or during major sales events like Black Friday or Cyber Monday.
Access Live View #
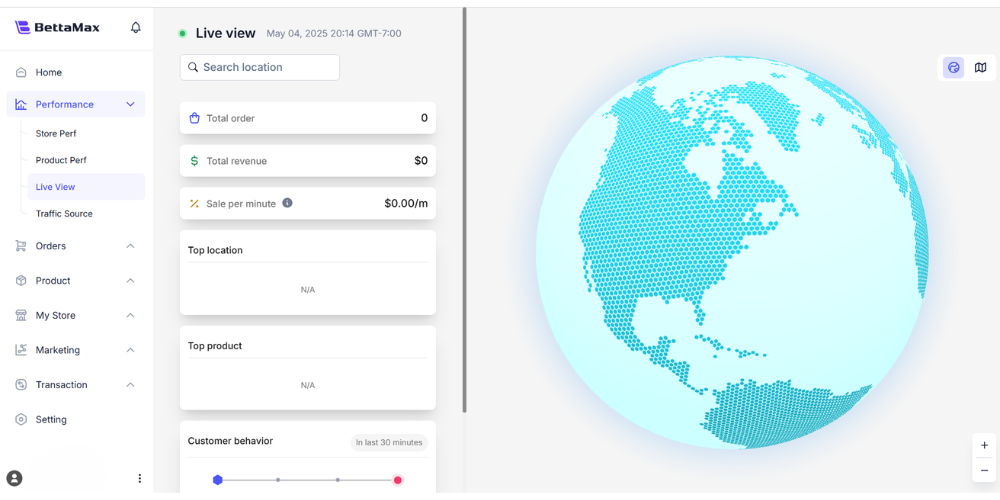
Live View is located in the Performance section of the sidebar. Once opened, the system loads the 3D map and displays the data immediately without requiring further configuration.
- From the sidebar, select Performance > Live View .
- The system displays a 3D map along with real-time indicators in a side panel.
Read real-time maps #
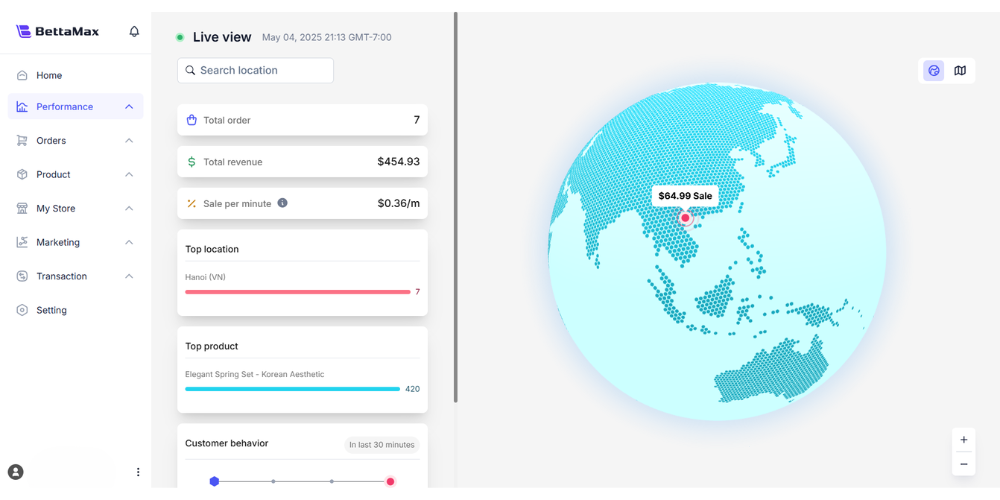
The map displays the visitor’s geographical location and order based on their IP address. The two types of dots have different meanings and are displayed at different times.
- Red dot : The order has been successfully placed. The order value is displayed at the customer’s location. It disappears after 1 minute.
- Green dot : The customer is viewing the product page. It disappears 1 hour after the last view.
Switch between 3D and 2D maps #
By default, Live View displays a 3D map . You can switch to a 2D map or adjust the zoom according to your viewing needs.
- By default, the map is displayed in 3D . Drag your mouse to rotate the globe.
- Tap the icon in the upper right corner of the screen to switch to 2D Map .
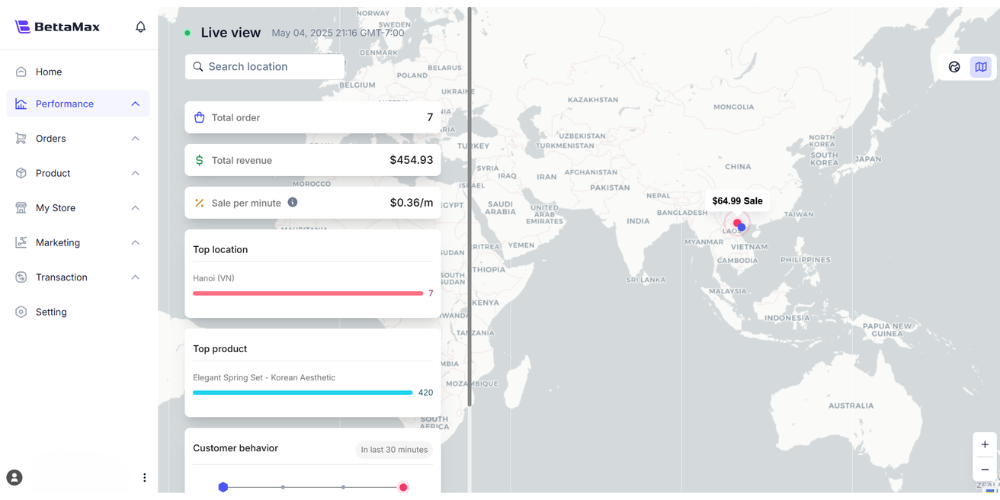
- Both modes support zoom: press + to zoom in (up to 150%), press – to zoom out (minimum 50%).
Search for a location on the map. #
Enter the name of the location in the Search Location box . The system will automatically suggest a location from the dropdown menu and zoom in on that location on the map.
Read the Metrics #
The Metrics section next to the map displays a summary of store performance since the beginning of today (0:00 according to the set time zone). All indicators below are cumulative figures for the day.
| Index | Meaning |
|---|---|
| Total Order | Total number of orders from 0:00 to now |
| Total Revenue | Total revenue from 0:00 to the present |
| Salt per Minute | Average revenue per minute = Total Revenue ÷ Number of minutes elapsed during the day |
| Top Product | The 3 products with the highest sales revenue of the day. |
| Top Location | The top 3 locations with the most orders, based on delivery address. |
Example of calculating Sales per Minute : If at 11:30 Total Revenue = $7,000, then Sales per Minute = $7,000 ÷ 690 minutes = $10.15/minute.
Read Customer Behavior metrics. #
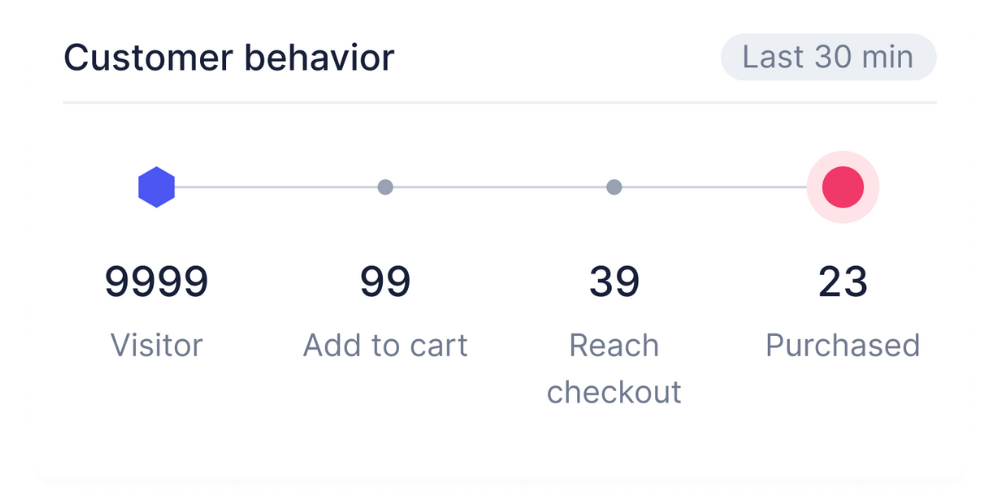
Customer Behavior displays customer behavior over the past 30 minutes , reflecting the real-time state of the purchase funnel. This is sliding data, not accumulated throughout the day.
| Index | Meaning |
|---|---|
| Visitor | Number of times customers viewed the product page in the last 30 minutes. |
| Add to Cart | Number of times customers added products to their cart in the last 30 minutes. |
| Reach Checkout | Number of times visitors have visited the checkout page in the last 30 minutes. |
| Purchased | Number of times customers completed payments in the last 30 minutes |
Read the funnel from Customer Behavior #
The ratios between the indicators show the leak point in the funnel. Use the table below to identify the problem that needs to be addressed.
- High visitor count , low add-to-cart count : the problem lies on the product page (images, description, price).
- High Add to Cart , Low Reach Checkout : The problem is with the shopping cart or shipping fees.
- High Reach Checkout , Low Purchased : The problem lies at the checkout stage.
Set time zone #
Live View defaults to GMT-7 Los Angeles . The time zone affects when the metric resets, so adjustments are necessary if you are tracking in a different time zone.
- Find the Time Zone option in the Live View interface.
- Select the appropriate time zone from the dropdown menu.